A monotone cubic spline: a smooth curve through data points that never overshoots them. Between two knots the curve only ever goes up, only goes down, or stays flat, following the knots. This makes it the usual choice for smoothing a line chart.
The knots are data points: each knot's x must be bigger than the one before it (or every one
smaller), otherwise it raises an ArgumentError. The curve is then a function of x: it never
loops back, and never goes above or below the knots either side of it.
A spline with n knots has n - 1 segments. Within each segment, x moves at a steady speed:
u = 1.5 is exactly halfway between the second and third knots' x.
curve = Curves.define_monotone([{0, 2}, {1, 2}, {2, 2}, {3, 8}, {4, 8.5}, {5, 3}, {6, 3}])

# Find any point along the curve (u goes from 0.0 to Curves.max_u(curve))...
Curves.solve!(curve, 1.5)

# ...or draw the whole curve as an SVG image
Curves.Svg.save!(curve, "monotone.svg")| Catmull-Rom, with the same data | Monotone |
|---|---|
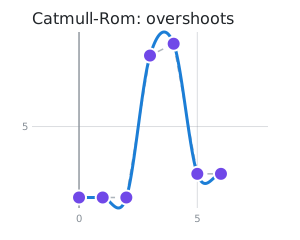 | 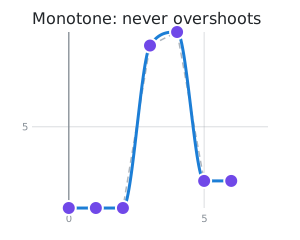 |
How it is built
It uses the Fritsch–Carlson method. Each knot gets a slope (how steeply y changes with x):
- The slope at a knot is the average of the slopes of the straight lines either side of it. The first and last knots use the slope of their one line.
- A knot where the data turns (one line goes up, the other down) or levels out gets slope
0, so the curve doesn't swing past it. - Where two neighbouring slopes are too steep for the line between them, both are scaled down until the curve between them can't overshoot.
Each segment is then the Hermite segment with those slopes, stored as a cubic Bezier curve whose
control points sit a third and two thirds of the way along in x.